
Measures in Power BI are really a beautiful feature. They are fast in the calculation, has the benefit of reusability. Measures can be applied to multiple tables. We create measures to obtain counts, averages, sums, ranking, percentiles, aggregating year to dates and many more handy calculations.
Measures are dynamically calculated. And most importantly it gets imported in other applications like MS Excel through its report format. A good data modelling and creating useful measures are among the core skills Power BI Pro users have.
So, in nutshell, measures in Power BI are one of the most important features you must know and use. In this article, I am going to discuss how to use them with a simple application using real-world data.
I would suggest going through this article for in-depth knowledge of Power BI measures. It is from the creator Microsoft itself. This article will give you the overview and the necessary idea about measures to apply the steps described here.
NB: Being a non-native English speaker, I always take extra care to proofread my articles with Grammarly. It is the best grammar and spellchecker available online. Read here my review of using Grammarly for more than two years.
The data set used
The data set used here is the same used to demonstrate the data modelling process in Power BI. For the first time readers, a brief description of the data is given below.
The data I used here is crop production data of different states of India. This data is accessible at Data.world. This is real-world data and without any garbage.
The columns are
- “State_Name” containing different states of India.
- “District_Name” containing state-wise different districts name
- “Crop_Year” has the year of production
- “Season” has the particular season of crop production
- “Crop” is the particular crop name
- “Area_ha” this column contains a total area of under the crop in Hectare
- “Production_tonnes” has a total production of the season in Tonnes
Use of DAX (Data Analysis Expressions) to create Measures
We use Data Analysis Expressions (DAX) in Power BI to create measures. The same DAX is used for Excel formulas. The only difference is, in Excel, DAX is applied on cells and columns whereas, in Power BI, DAX is applied on tables and columns of the data model. And they are very fast in calculations.
Implicit and explicit measures: which one you should use?
Measures are of two kind one is implicit measures which gets calculated by default and the other one is explicit measure. Now both of these measures yield the same result.
But there are subtle differences between the calculation approaches of these two. Which you should know and use accordingly.
Implicit measures are easy to calculate and you need not write any DAX expressions for it. But it has its own share of disadvantages. Which is Implicit measures are not reusable.
On the other hand, explicit measures require some knowledge of writing DAX expressions to achieve desires result. But they can be reused. Also, you can make little changes in the DAX expression you wrote to use it for other calculations.
An example of limitations of Implicit Measures is its inability to handle division by 0(zero). If there are some calculations have divisions and your data contains some zeros in the numerator, then Implicit Measures will give garbage values.
But such a situation is well handled by Explicit Measures. Where these measures through a tiny error displaying “NAN” i.e. “Not A Number”. In this way, you can understand the possible problem and can correct it.
New Measure and Quick Measure
These two are another options provided by Power BI when you need to create measures. Now again, creating a Quick Measure is easy and does not require writing DAX expressions.
Where creating New Measure needs writing few lines of DAX expressions. But it has some advantages over Quick Measures. I will discuss it with example here in a bit.
The figure below displays the options for creating “New measure”, “Quick measure”, “New column” and “New table”.
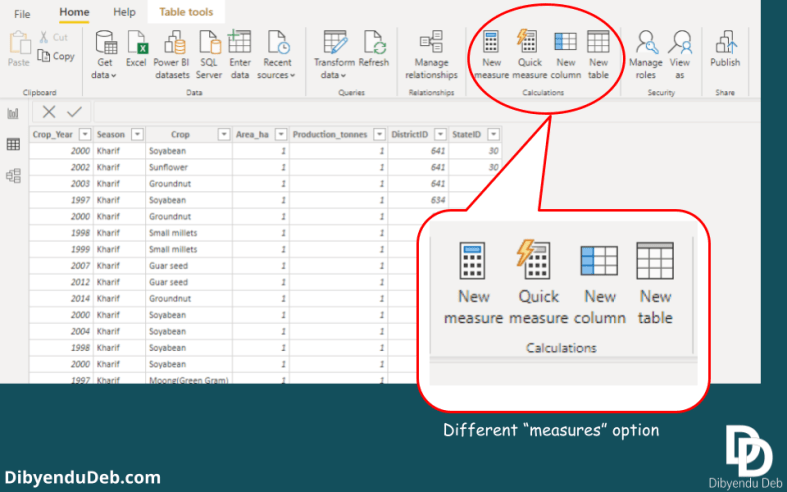
While in case of “Quick measure” a wizard opens which help us to define the calculation. Again it is easy as we don’t have to bother about writing DAX at the cost of losing the flexibility and reusability offered by it.
Common mistake while creating new measure
Here I would like to mention a very common mistake while you are in the process of creating you first ever New measure. It may sound silly but related to very basic concept of measure in Power BI.
The role of a measure in Power BI is to apply some aggregate functions of the column values in the report. So, it is important to remember that measures can not be created using single row values.
See the error thrown by Power BI in the below figure when I have tried to create a new measure using single row values. My intention was to calculate productivity by dividing crop production with the area.

And the error clearly directed me that a “single value” can not be determined. We need to create “New column” for that purpose.
Creating a “New column”
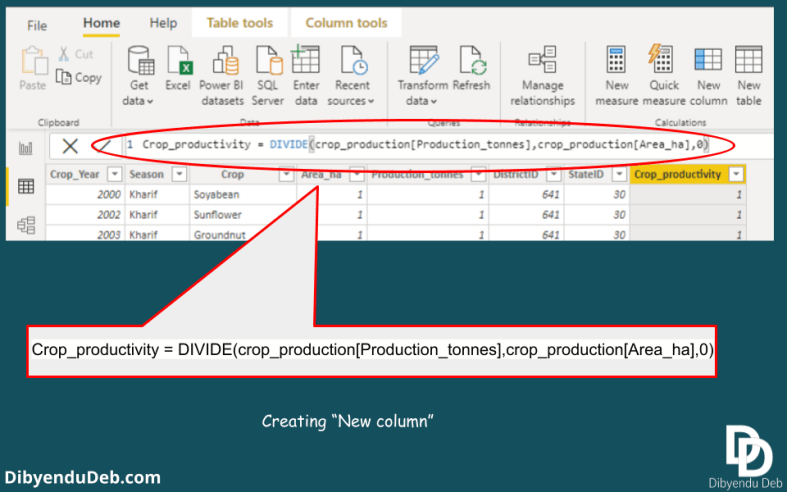
For creating a column to calculate the productivity from the crop production and area values, we will create a “New column” here. Simply click the “New column” option. A formula bar will appear where we need to write the DAX for the calculation.

Now see in the below figure where the DAX has been written for crop productivity calculation. Important to note that I have mentioned an alternate value as 0 at the end of the expression. It avoids the problem that arises whiling dividing by 0.
Creating “New measure”: an Explicit measure
While we create new measure by clicking the “New measure” option, a formula bar appears in the window. See the below figure. The “Fields” pane at the right also starts to display the Measure with a calculator icon. By default, a new measure has the name “Measure”.

Now we have written a DAX for calculating the average crop production. Its very simple and remember selecting the relevant table while writing the DAX. It will help you select the right column by prompting from the selected table columns.

As I have already said that explicit measures are reusable, it means that one explicit measure can be used to create another explicit measure.
Application of an Explicit measure

Implicit measures
Here we will see how a measure can be created implicitly. It is an easier option compare to explicit measures. But it is always advisable to go for an explicit measure for its several advantages as I have discussed before.
In the below figure you can see that a bar plot has been created for the Area_ha column. By default it is the sum which is selected. You can change to other options as available in the figure.
And all these options create an implicit measure for each of them. You will not get them in the field options there. Which means that implicit measures are not reusable. Every time you want to do the same calculation, you have to go through the same process.

The bar plot takes only the measure “Area_ha” which gives the sum of all the cropped area from all the states. So, it gives a single bar for a single value. You can drill down further to any level adding them as values.
Like in the below image we can see that the cropped area has been displayed district wise.

Final words
In this article, we have mainly focused on creating measures both implicit and explicit. Both measures have been shown using practical examples.
As I have discussed the merits and demerits of both the measures, it is prudent that creating explicit measures always has the edge. Implicit measures are easy to apply. That’s why any new Power BI users always prone to use the implicit measures.
Although in the long run, when he delves into more advanced use of Power BI, the data size and complexity increases, he finds that using implicit measures are not helpful in terms of their reusability.
Also, as the Explicit measures get dynamically calculated, it puts less burden on the computer memory and quick to give result.
Hope this article will help you to get a good grip and understanding on the use of measures. If you have any queries or issues regarding application of measures let me know through comments below.
I would like to address them which will enrich my knowledge too.